Some Madison Elementary Schools are Tops
As you can see, Madison schools are simultaneously excellent and terrible. The top 8 are MMSD schools as are 6 of the bottom 10. Wow!
Not only does MMSD have top elementary schools in the area but the top 8 are above the 95% percentile statewide. That means those 8 schools are better (with respect to my measurements) than 95% of the other elementary schools in Wisconsin.
Furthermore, MMSD schools Lowell, Randall, and Van Hise are the #1, #2, and #3 elementary schools STATEWIDE. Yes you heard right. According to my ranking those are the 3 best elementary schools in the state for non-poor students.
Of the top 25 schools statewide, 7 are MMSD schools. No other area schools make the top 25.
You might consider moving to one of those attendance areas because these schools and the students in them are really, really good.
Other Madison Schools are the Pits
6 out of 10 of the worst area schools are also MMSD schools. WTF? These aren't poor kids scoring so badly either. I sliced and diced the data and couldn't find any demographic explanation for the bad scores. For those bad schools, no demographic group has a significantly higher score than the average shown (not white, asian, or black, kids, girls, boys, nothing). The only explanation can be that some of those schools are truly terrible.
How did I analyze the data?
The data are essentially the same as described in this post except for "Assumption 3". This time instead of selecting white student's data as a proxy for socio-economic class, I took a poster's advice and used data for students who are not "economically disadvantaged." You can read about what defines that here.
The reason I'm restricting to the non-poor is to compare apples-to-apples. Averages across all students don't really tell the story. It's sort of like saying that Medina, WA with a population of about 3,000 and the home of Bill Gates, has an average per-capita net worth of $19,000,000. That's sort of silly, right? Poor students are much more challenging to educate and thus skew averages for districts with no poor students higher.
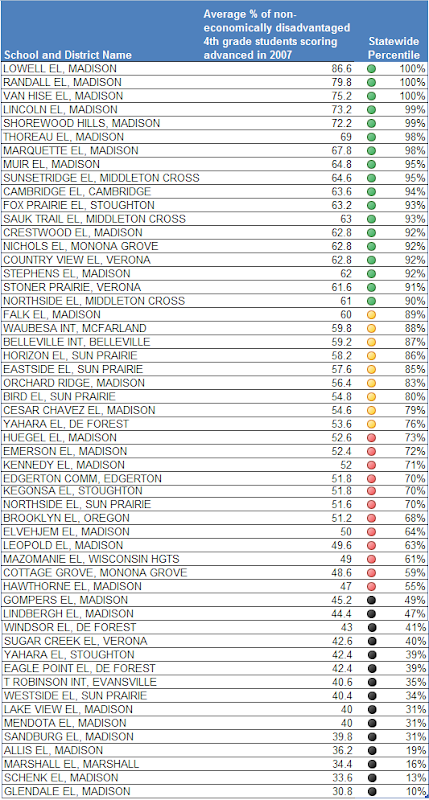
So the short story can be seen in the table below. To explain the numbers, for example, Marquette Elementary in Madison had an average across all subject tests of 67.8% of its (non-poor) students test in the "Advanced" ranking. That 67.8% puts Marquette in the 98%-th percentile of elementary school state-wide. That is to say, Marquette has higher scores than 98% of all the other elementary schools in the state.
Where's my school?
You might notice your school not on this list. Waunakee, for example, does not report any data for poor versus non-poor students. Perhaps that's because no elementary school students qualify for free lunch? If you don't see your school on the list, they did not report the non-poor category of students.
Also, I've restricted my analysis to the following districts: Belleville, Cambridge, De Forest, Deerfield, Edgerton, Evansville, Madison, Marshall, McFarland, Middleton-Cross Plains, Monona Grove, Oregon, Stoughton, Sun Prarie, Verona, Waunakee, and Wisconsin Heights.
No comments:
Post a Comment