It was the best of times, it was the worst of times
As you can see in the table below, Madison has some kickin' schools and some really dismal ones.
Table of ResultsAs you can see in the table below, Madison has some kickin' schools and some really dismal ones.
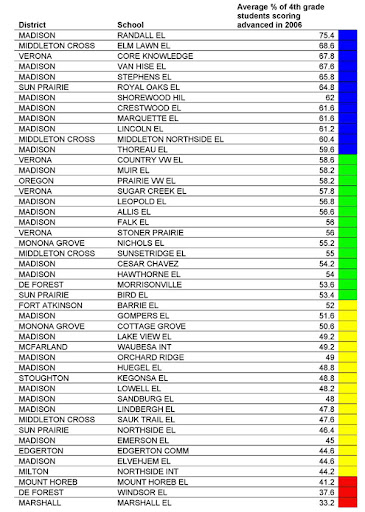
Below is a table of the results I obtained by ranking area elementary schools by advanced scoring percentages.
As you can see the range is pretty broad from 33.2% to 75.4%. The top school, Randall Elementary, had an average of 75.4% of students scoring in the Advanced range across the 5 tests administered. This is an excellent score. This score puts Randall below only two other elementary schools statewide. Keep in mind, this is out of about 550 elementary schools I analyzed – that’s really, really good.
Statewide color ranking explanation
I’ve made a color-coded column in each chart that represents the performance of the school relative to the state-wide performance of schools in its category. By relative performance, I mean its percentile rank. Here’s the key:

To explain, notice the schools with the red marker at the bottom? Those 4 schools are in the bottom 50% percentile in the state. That means they are worse than half the schools in the state. See the top 12 on the list that have a blue marker? Those 12 schools are in the top 10% of schools in the state.
My take on this is that it’s pretty important where, exactly, you live and which elementary school you go to. Madison has the best elementary school and the 6th from the bottom. So you can’t just say “Yeah Madison schools are excellent.” You can, however, say my particular school is excellent. Notice that of the 12 in the top 10%, 8 are Madison schools.
I think it’s fair to say you shouldn’t get all pumped up about moving to, say, Mount Horeb because, relatively speaking, it’s got a pretty poor elementary school according to my calculations.
4 comments:
It would be interesting to see this analysis done with only language arts and math, and possibly science as well. That is where the most variability is at. Social studies just gums up the works, since almost everybody seems to have 75% or more advanced. Reading doesn't appear to be as variable as one might expect. Within your top 10% schools, there are schools that are 30%age points apart on math/language arts.
If you look at the numbers for low-SES vs. non-low-SES, they are fairly similar to white/non-white. I know that personally I am more comfortable with seeing categories divided by SES.
This looks like it was a bit of work. Thanks.
Looking at this information is interesting but what I find more interesting is to figure in the low income and ESL percentages. It looks to me that Lincoln school is rated very high. I think we need to take a look at what they are doing there and see if that can be used elsewhere. Several of the Madison schools are much more diverse than you will find in other areas of the state. Every school is different so it is difficult to compare them all using only one data source.
In response to Karl's comment regarding Lincoln, remember that Lincoln is paired with Midvale for K-2.
I live in the Midvale attendance area, and many parents and students I know from this section of the attendance area have had a fabulous experience. Others have had a negative experience. If we stay in our current neighborhood, our daughter will attend the pairing.
Chris states that the data presented focuses on the 'white' student demographic. Since he is is quite clear in his methodology, we should ask, does the data represent this unique situation?
There are (at least) three other elements to consider:
1)Look at the WINSS data in more detail (by race/ethnicity and economics), and you will see that Lincoln's white, non-economically challenged and English-speaking student populations perform quite well. The kids on the other side of the fence don't do quite as well, to say the least. Additionally, the 2005 statistics I saw on the WINSS web site indicated that 18% of the student population wasn't even tested. (I don't know if the exclusion percentage or reasons are typical for the district.)
2)The Midvale-Lincoln population is very diverse both ethnically and economically, and the Midvale students are predominately white and from middle to upper-middle class families. (The more upscale Fitchburg developments now in the Lincoln attendance area might ultimately even up the balance, but...we'll see.) The Midvale kids are also more likely to attend the Lincoln Open Classroom, which provides segregation within the school itself. (This point is often skirted by the MMSD when questioned or challenged, but that's a whole other can of worms.)
3)Lincoln has been, up to now, exempt from a standard student to teacher ratio, which is now on Supt. Rainwater's cut list. Therefore, if the recommendation is passed, the current ratio of 20:1 for grades 4 & 5 will go to 25:1.
So, yup, the data for the 'white' kids currently look very good. Not so great for everyone else.
Beware that this situation will will also apply, although with better demographics for the other paired school (Franklin), to Randall.
Chris, the two other elementary schools should be considered in Stoughton's section of the list...Yahara and Fox Prairie. Currently, only Kegonsa is listed.
The WINSS data shows the test scores are historically better at both Yahara and Fox Prairie than Kegonsa, although I believe that gap is closing. Some changes are being made to the attendance areas.
Post a Comment