Showing posts with label madison. Show all posts

Wednesday, December 23, 2009

High Schools in 2009

For high school rankings, not much is different from 2008 although there seems to have been a slight trend upward of all the area schools.


Thursday, November 5, 2009

Middle Schools and Obama's Visit

Non-Economically Disadvantaged Comparison

With Obama's recent visit to Wright Middle School, it seems like an opportune time to post the statistics for area middle schools.

Despite the apparent success of Wright, I wouldn't identify it as a particularly great school based on the data. As usual these data are for non-economically disadvantaged 8th graders.

As you can see James Wright (James Wrt) falls quite low in the rankings although I guess it's not so terrible compared on a state-wide basis. 44th percentile statewide is no great shakes though.

The top few remain generally the same year to year but switch places slightly. The top 5 schools are all Madison metro. Low and behold, the bottom 4 are also Madison metro.

I think both O'Keefe Middle School and Hamilton should be called out specifically this year though. In state-wide rankings across all middle schools, Hamilton comes in at #3 and O'Keefe at #5. Those are darn good scores.

The chart is below.


Economically Disadvantaged Comparison

Not to be a jerk about it but if you compare economically disadvantaged students across these same middle schools, you don't see James Wright as a stellar performer there either.

The overall scores are pretty abysmal across the board but if you compare these using statewide percentiles, you can get some idea of the quality of these schools with regard to educating the poor.

Spring Harbor does a pretty impressive job with low income students. Spring Harbor is a magnet school so I'm guessing it tends to draw the more education-oriented students of all types.

At 16th percentile statewide, Wright is no miracle cure at this point. Maybe the education money from the feds will help.


Wednesday, October 21, 2009

Latest Madison-area elementary stats for 2009

I'm a bit late on the new data which arrived early this summer but here you can see some new charts for the 2009 (really the 2008 data released in 2009). Here you can see the local elementary schools and their rankings.

Looks like the top 10 remained mostly the same. Shorewood Elementary moved up, Van Hise moved down a little but not dramatically. Lowell inexplicably shot up from the 63rd percentile to the 98th percentile. And, yes, I double-checked and the data are accurate. Again 8 of the top 10 elementary schools are Madison Metro (MMSD) schools.

I would say though that all the schools falling into the 90th percentile state-wide are excellent though. Keep in mind that means those schools produce better students than 90% of the other schools in the state. That's pretty darn good.

MMSD has the dubious honor of having 9 of the 10 worst schools in the area though. And Allis coming in at the 5th percentile is tragically bad. I reiterate the fact that your school quality varies dramatically based on exactly where you live within a district.


Monday, March 30, 2009

School district performance over time

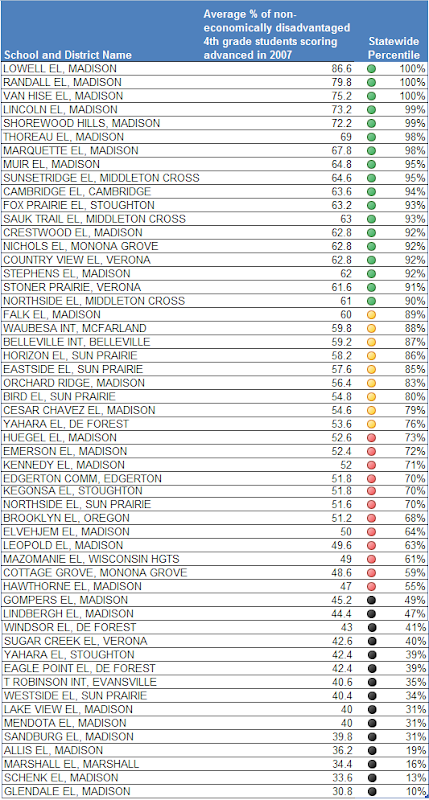
If you were wondering how a few of the districts seem to be performing over time, it seems there is no discernable trend. The chart below shows 10th grade average scores for school districts and as you can see, they bump up, they bump down but there's no obvious trend other than perhaps a general narrowing of the gaps between them.


Friday, October 5, 2007

Dane County Middle Schools 2007 Rankings

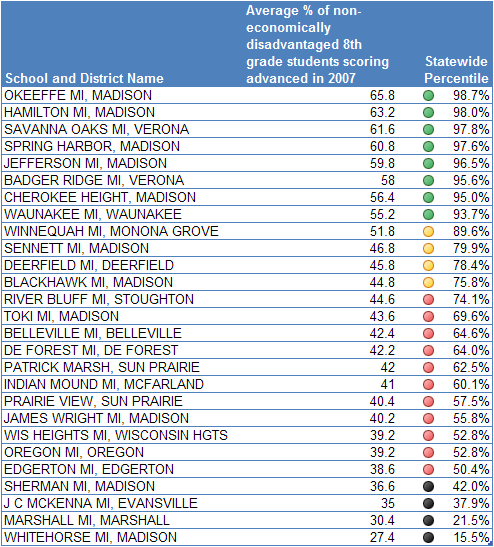
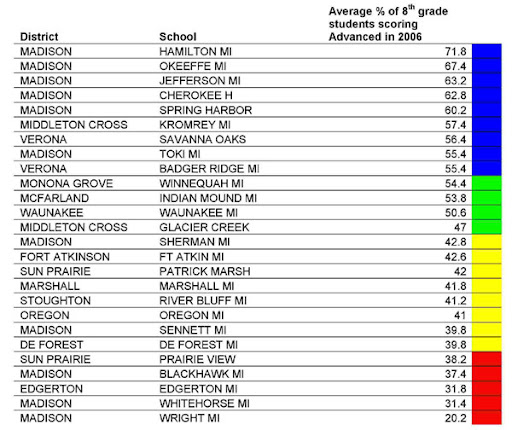
So you know when I say 2007 rankings, the test data is from 2006, right? Anyway again comparing only non-economically disadvantaged students, you can see 6 of the top 10 are Madison schools; both Verona schools are up in the top 10 as is Monona and Waunakee.

In general, I would say that the middle schools of the area seem to be doing pretty well. There are a couple duds way down at the bottom but you'll notice a lot fewer black circles than in my previous post on area elementary schools.

Of course I wouldn't say being in the 50th percentile statewide is any great accomplishment but, hey, at least it's not Whitehorse down in the 16th percentile there.

Something to take note of is that O'Keefe and Sherman have been merged. Some of Sherman's students are at O'Keefe and some at another school. I'm sure we can expect the excellent score of O'Keefe to descend precipitously as we average the 36.6 from Sherman with the 65.8 of O'Keefe to get, what, 51.2 dropping the best middle school down to 7th place or something.

You know the MMSD board really needs to be more aware of perception versus education. It is true that the goal is to educate all children highly. It is also true that that ain't gonna happen! One thing they can do something about is managing perceptions. Is it better to say, MMSD has the 6th best middle school in the state (non-poor, etc, etc) and a bad school? Or is it better to say MMSD has some above average middle schools? My thought is the prior. People demand excellence not above averageness.

Anyway again can anyone explain how Whitehorse can be so bad while O'Keefe can be so good?


Wednesday, October 3, 2007

Dane County Elementary Schools Re-ranked

-The 2007 state testing data is out and I thought I'd take another look. Again I'm looking here at Dane County area schools only compared with each other and state-wide as well. The data you will see only includes non-poor students -- you can read more about why below.

Some Madison Elementary Schools are Tops

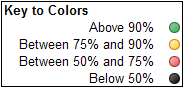
As you can see, Madison schools are simultaneously excellent and terrible. The top 8 are MMSD schools as are 6 of the bottom 10. Wow!

Not only does MMSD have top elementary schools in the area but the top 8 are above the 95% percentile statewide. That means those 8 schools are better (with respect to my measurements) than 95% of the other elementary schools in Wisconsin.

Furthermore, MMSD schools Lowell, Randall, and Van Hise are the #1, #2, and #3 elementary schools STATEWIDE. Yes you heard right. According to my ranking those are the 3 best elementary schools in the state for non-poor students.

Of the top 25 schools statewide, 7 are MMSD schools. No other area schools make the top 25.

You might consider moving to one of those attendance areas because these schools and the students in them are really, really good.

Other Madison Schools are the Pits

6 out of 10 of the worst area schools are also MMSD schools. WTF? These aren't poor kids scoring so badly either. I sliced and diced the data and couldn't find any demographic explanation for the bad scores. For those bad schools, no demographic group has a significantly higher score than the average shown (not white, asian, or black, kids, girls, boys, nothing). The only explanation can be that some of those schools are truly terrible.


How did I analyze the data?

The data are essentially the same as described in this post except for "Assumption 3". This time instead of selecting white student's data as a proxy for socio-economic class, I took a poster's advice and used data for students who are not "economically disadvantaged." You can read about what defines that here.

The reason I'm restricting to the non-poor is to compare apples-to-apples. Averages across all students don't really tell the story. It's sort of like saying that Medina, WA with a population of about 3,000 and the home of Bill Gates, has an average per-capita net worth of $19,000,000. That's sort of silly, right? Poor students are much more challenging to educate and thus skew averages for districts with no poor students higher.

So the short story can be seen in the table below. To explain the numbers, for example, Marquette Elementary in Madison had an average across all subject tests of 67.8% of its (non-poor) students test in the "Advanced" ranking. That 67.8% puts Marquette in the 98%-th percentile of elementary school state-wide. That is to say, Marquette has higher scores than 98% of all the other elementary schools in the state.

Where's my school?

You might notice your school not on this list. Waunakee, for example, does not report any data for poor versus non-poor students. Perhaps that's because no elementary school students qualify for free lunch? If you don't see your school on the list, they did not report the non-poor category of students.

Also, I've restricted my analysis to the following districts: Belleville, Cambridge, De Forest, Deerfield, Edgerton, Evansville, Madison, Marshall, McFarland, Middleton-Cross Plains, Monona Grove, Oregon, Stoughton, Sun Prarie, Verona, Waunakee, and Wisconsin Heights.

Tuesday, April 17, 2007

High Schools

Madison has the same issues with high schools as with middle schools: the top 2 and #3 from the bottom. By the way Madison West is the #2 high school in the state out of 265 others. I suspect with the Madison high schools, you could average the feeder middle school scores and get a close relationship to the high school average. Clearly LaFollette is a problem.

The relatively dismal performance of Monona Grove HS is interesting – I would not have guessed that.


Tuesday, April 10, 2007

Middle Schools


Same methodology; shorter list! Here you can see Madison schools simultaneously thrashing the competition but also being incredibly bad. This is why you can’t just say “Oh the average MMSD score is so low – it must be a terrible school district.” Looky – the top 5 schools are Madison middle schools. 6 of the 9 in the top 10% are Madison middle schools.

Hamilton Middle school is 6th from the top among the 320 or so middle schools statewide. Again that’s pretty darn good. On the other hand, if your kids go to Wright or Whitehorse, you probably want to move or request an intra-district transfer if you can.


Sunday, April 1, 2007

Elementary Schools

It was the best of times, it was the worst of times

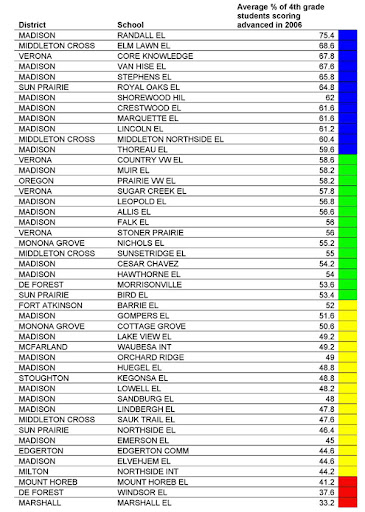
As you can see in the table below, Madison has some kickin' schools and some really dismal ones.

Table of Results

Below is a table of the results I obtained by ranking area elementary schools by advanced scoring percentages.

As you can see the range is pretty broad from 33.2% to 75.4%. The top school, Randall Elementary, had an average of 75.4% of students scoring in the Advanced range across the 5 tests administered. This is an excellent score. This score puts Randall below only two other elementary schools statewide. Keep in mind, this is out of about 550 elementary schools I analyzed – that’s really, really good.


Statewide color ranking explanation

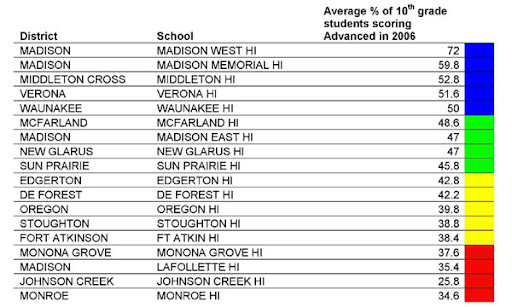
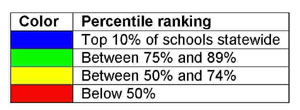
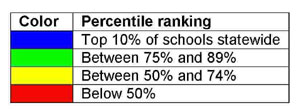
I’ve made a color-coded column in each chart that represents the performance of the school relative to the state-wide performance of schools in its category. By relative performance, I mean its percentile rank. Here’s the key:


To explain, notice the schools with the red marker at the bottom? Those 4 schools are in the bottom 50% percentile in the state. That means they are worse than half the schools in the state. See the top 12 on the list that have a blue marker? Those 12 schools are in the top 10% of schools in the state.

My take on this is that it’s pretty important where, exactly, you live and which elementary school you go to. Madison has the best elementary school and the 6th from the bottom. So you can’t just say “Yeah Madison schools are excellent.” You can, however, say my particular school is excellent. Notice that of the 12 in the top 10%, 8 are Madison schools.

I think it’s fair to say you shouldn’t get all pumped up about moving to, say, Mount Horeb because, relatively speaking, it’s got a pretty poor elementary school according to my calculations.

Friday, March 30, 2007

The Wisconsin state school data and how I used it

The data I analyzed consisted of the state standardized tests given to students in grades 4, 8 and 10. This covers elementary, middle and high schools so we can get a decent idea of the relative quality of the various school levels.
The tests have several sections (e.g. reading, math, science, etc.) and they do not provide raw scores. Instead they provide the percentage of students scoring in one of 4 groups:
  • Minimal performance
  • Basic
  • Proficient
  • Advanced
So for one school and one test, you’ll get something like:


Math


Minimal performance

7%


Basic

23%


Proficient

40%


Advanced

30%


Assumptions

In order to make any sense of this mass of data, I had to make a bunch of assumptions and selections of the data that I considered important to me and people like me (including my friends who had the original question).


Assumption 1: The percent of students scoring in the Advanced score range represents the quality of a school.

First, just like in Lake Wobegone, everyone assumes their kids are above average and I’m no exception. I assume that my kids have the ability to be in the Advanced score range. The more kids a school has in the Advanced score range, the more likely my kids will be able to be in that range.

Second, this seems like a reasonable proxy for educational quality. If one school has 5% of its students scoring in the Advanced range and another has 35% in the Advanced range, which one do you think is better?


Assumption 2: The average of percentages of students scoring in the Advanced range over all tests for a particular grade represents the overall quality of a school.

Since there are 4-7 tests taken, I had to combine them somehow into one number. I chose to average across all the tests at a particular school the percent of students scoring in the Advanced score range.

One problem is obviously that a school could have a fantastic Math score and a dismal English score resulting in a reasonably good average. A second problem is that a statistician might have a problem with this averaging strategy – comments welcome if you’re a stats whiz.

I think, however, this reasonably combines the scores to obtain a single number for one school.

Assumption 3: We’re all white. NOTE FOR THE 2007 and later data, I used non-economically disadvantaged students rather than white.

I only collected and compared scores of white/Caucasian students. I did this for two reasons.

First, I was specifically concerned with my kids’ opportunities not yours. If you’re non-white, I’m sorry, you can try to figure this out yourself for your own demographic and you probably should. If they had more specific demographics that relate to educational performance, I would have used that as well (e.g. parents educational level, etc.) but they only provide race and gender. My reasoning is that if a school is good for my kids’ particular demographic then it’s good for their education.

My guess is that in this data set, race is actually a proxy for economic class which, I think, is probably a better predictor for academic achievement. So my guess is that these results apply to all races having a similar economic status to the average white Madisonian.

Second, I had a feeling that the well-known and unfortunate “achievement gap” between whites and minorities causes the statistics to be not comparable between schools with varying minority populations.

Clearly the achievement gap is a problem in schools with significant minority populations and needs to be addressed. I’m just not analyzing or addressing it here.

Introduction to my Comparison of Madison Area Schools

What is this blog?

This blog will contain my personal analysis of Dane County schools primarily based on the state testing data. The posts are really intended to be read sequentially, more or less. So far it's not really a stream-of-consciousness like a normal blog; rather it's more of a straightforward analysis.

Why bother with this?

Our friends recently mentioned that they were concerned with the Madison schools among other things and were thinking about moving to a small town like Lodi. Other people we know are putting their kids in private school. I thought that Madison schools might not be in the dismal situation that seems to be the conventional wisdom today but I couldn't say for sure.

I stumbled upon the State of Wisconsin web site that provides test scores for various grades for every school in Wisconsin and decided to conduct an analysis to see what I could discover about the various schools in the area. Should we move? Should they move? Should you be concerned about the schools? I attempt to answer these questions given numerous assumptions.

Summary of Results

Madison has the best schools in Dane county and among the best in all of Wisconsin.

But, and it’s a big BUT, you have to make sure you’re in the right one. Choose poorly and you get a relatively bad school.

Verona and Middleton also seem to have good schools comparable to the Madison ones. You still need to choose the best one by location but you won’t end up with bad one anywhere in either Verona or Middleton.
The trend in Madison’s elementary school test scores seems to be heading toward the middle rather maintaining high scores and increasing low ones.

Some area schools are relatively bad. Does that mean your kid won’t get a decent education there? No. What does it mean? I think it means that your kid will more likely have average scores than high scores. If you think your kid is going to be a hard-working average student, then it probably doesn’t matter where your child goes is my guess.